Current Legislative Council Boundaries


current LC divisions diagram

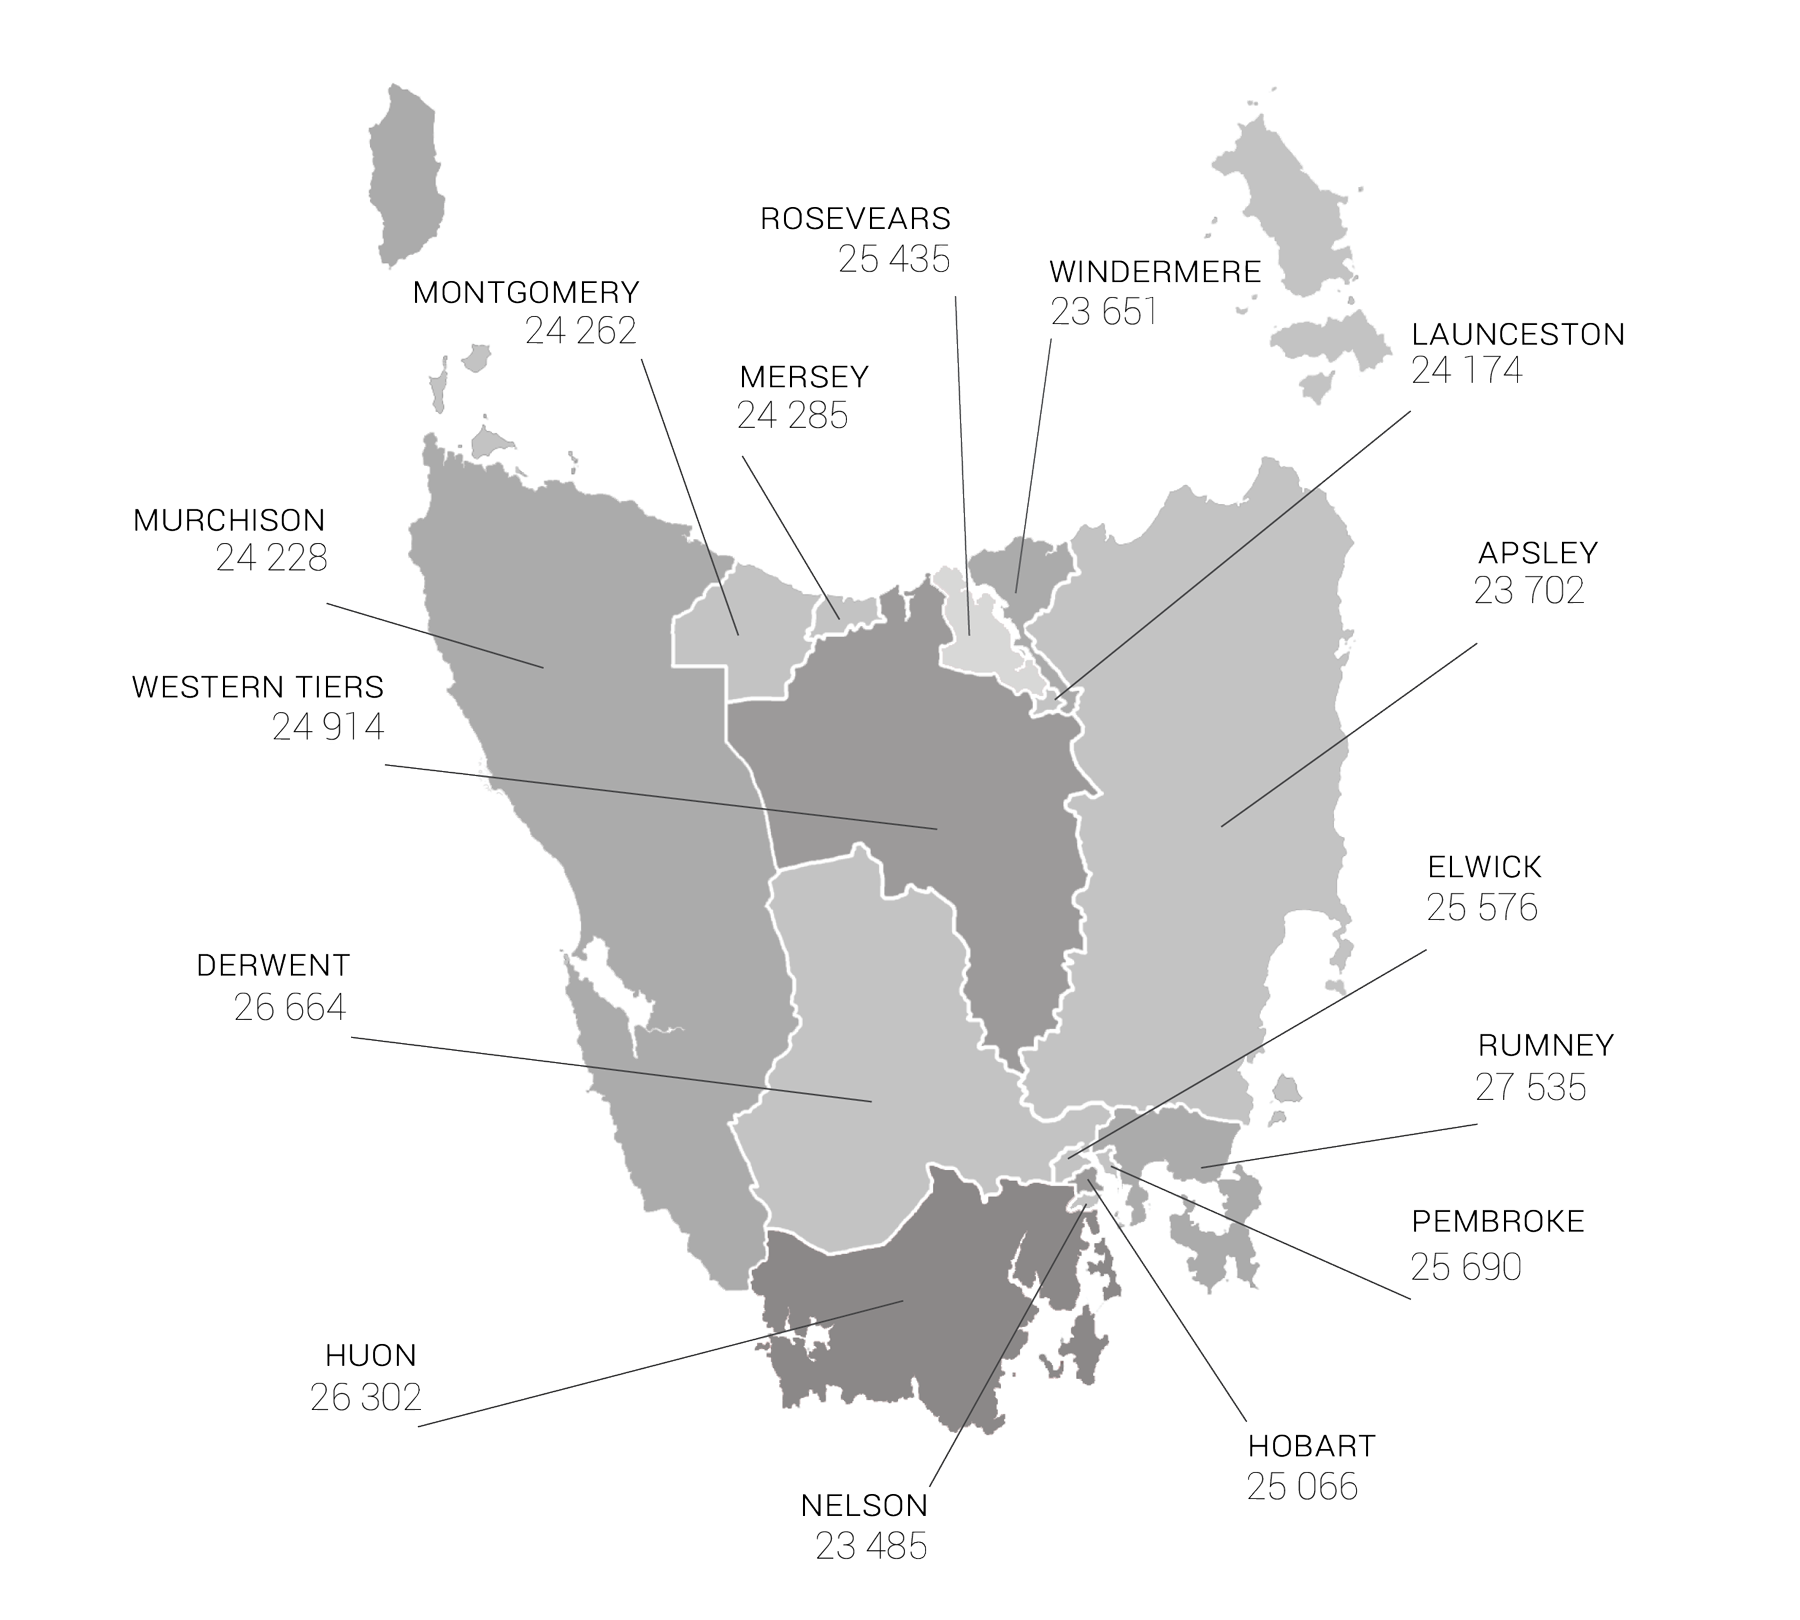
Enrolment figures as at 30 September 2016


current LC divisions map

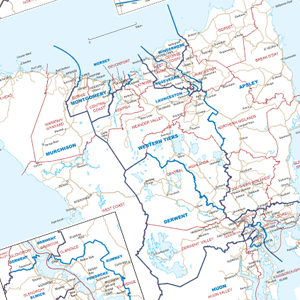
  High resolution map suitable to print for research purposes

[5.7MB PDF, opens in new window. Right click the PDF and select download]

Electoral Statistics - Enrolment by Area, as at 30/09/2016


Division

Enrolment

Variation

Variation as %

Apsley 23 702 -1 296 - 5.18%
Derwent 26 664 1 666 6.66%
Elwick 25 576 578 2.31%
Hobart 25 066 68 0.27%
Huon 26 302 1 304 5.22%
Launceston 24 174 -824 -3.30%
Mersey 24 285 -713 -2.85%
Montgomery 24 262 -736 -2.94%
Murchison 24 228 -770 -3.08%
Nelson 23 485 -1 513 -6.05%
Pembroke 25 690 692 2.77%
Rosevears 25 435 437 1.75%
Rumney 27 535 2 537 10.15%
Western Tiers 24 914 -84 -0.34%
Windermere 23 651 -1 347 -5.39%
Total Enrolment 374 969
Average Divisional Enrolment 24 998

© Redistribution Committee and Tribunal 2017